for Ergonomics, Biomechanics & Medicine

DynaMap for FlexComp Infiniti
DynaMap for ProComp Infiniti
DynaMap for ProComp+
DynaMap for ProComp2
More Thought Technology Products
Other Medical Products
DynaMap Suite
The BioGraph Infiniti DynaMap Suite, combined with any of four Thought Technology encoders; FlexComp Infiniti, ProComp Infiniti, ProComp+, or ProComp2, lets you record, replay and review 2-10 channel SEMG monitoring and biofeedback sessions.
Over 100 screens display SEMG readings combined with other physiological signals. A key feature is live video, which enhances the review of data enabling one to view the video display while pinpointing a moment in time for statistics for each measure. Dual monitor screens also play a key role in the software, allowing the client to view what is required for feedback and the clinician to view the actual data. The BioGraph Infiniti software also lets you edit the existing screens and create new ones of your own.
DynaMap for the FlexComp Infiniti
DynaMap for the FlexComp Infiniti provides 7 channel sets and 57 screens for high resolution and accurate multi-channel SEMG data-acquisition. The 7 channel sets allows you several choices: connect up to 10 MyoScan-Flex sensors for raw SEMG recording, a combination of 6 MyoScan-Flex Sensors and 4 Goniometers, 6 MyoScan and 2 Goniometers, 6 MyoScan with 2 Force Sensors, 10 Force Sensors, 10 Goniometers, 2 MyoScan-Flex with EKG, Temperature and Skin Conductance for SEMG and peripheral biofeedback. On-board Compact Flash memory gives you the capability to save data directly to the encoder for real life assessments away from the office or lab.
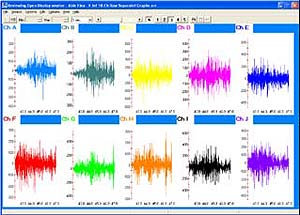
The screen above enables the recording and review of 10 channels of high resolution SEMG data recorded at 2048 samples/second from the 10 FlexComp channels for research or clinical use. The dual monitor screen (below) displays 10 channels of raw SEMG, each on its own line graph, a digital readout of each channel converted to RMS and a video to display feedback from a web camera to a second screen, makes the system ideal for athlete or ergonomic applications.
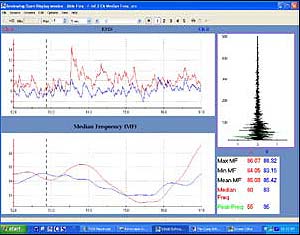
Below is a two channel recording screen, for observing the interplay of median frequency and RMS data between two bilateral sites. All median frequency (MF) statistics are based on smoothed MF to provide a smoothed view of this measure.
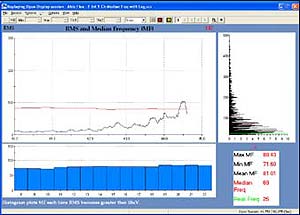
The single channel recording screen, below, is for reviewing a trend of median frequency and RMS data over a clinical session. By changing the settings for the comparator virtual channel, it is possible to trigger on the rising or falling edge of the RMS. A histogram is depicted at the lower 1/3 of the screen.
DynaMap for the ProComp Infiniti
DynaMap for the ProComp Infiniti includes 7 channel sets and 48 screens for multi-channel raw and RMS SEMG combined with up to 6 other physiological measures.
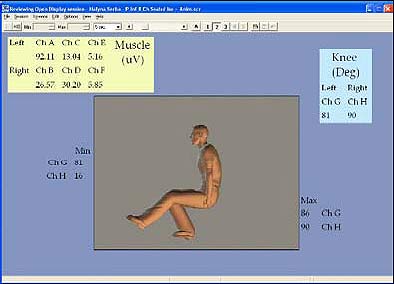
Screens include exciting new 3-D graphics of animated figures that work with the client. As the client moves the animation moves! In addition there are screens to look at the interplay of median frequency and RMS data between bilateral sites. The raw EMG signals can be displayed raw or, as RMS in line graphs and bar graphs as well as 2-D and 3-D spectral displays synchronized with video.
The 2 channel recording screen below is for looking at interplay of median frequency and RMS data between two bilateral sites. All median frequency (MF) statistics are based on smoothed MF to provide a smoothed view of this measure. This screen helps to show a trend of median frequency and RMS data over a clinical session.
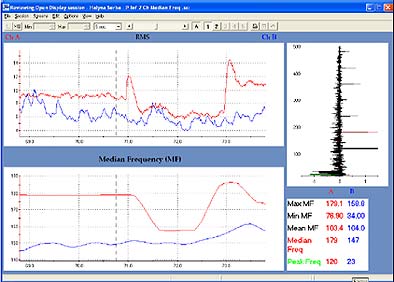
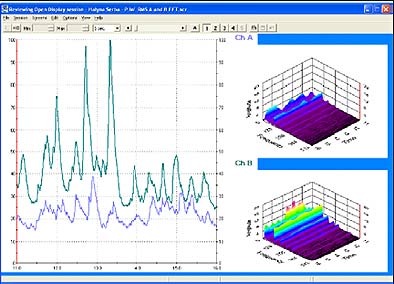
The screen below shows two channels of RMS data derived from channels A and B raw inputs to the ProComp Infiniti shown in a multi line graph and 3D power spectrum displays.
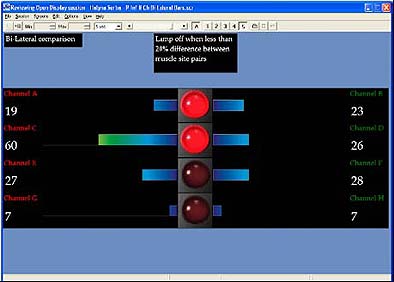
Four pairs of channels A vs B, C vs D, E vs F, and G vs H showing when greater than 20% difference when the lights turn red. The screen below is designed with the intent of evaluating lumbar muscle pairs during forward flexion, to aid in the bilateral evaluation of problem areas. Animated bars and digital displays show RMS SEMG of each muscle site.
DynaMap for the ProComp+
DynaMap for the ProComp+ encoder includes 7 channel sets and 37 screens for 8-channels of SEMG or a mix of 2 channels of SEMG with up to 6 other physiological measures. Build your own screens using one of our comprehensive channel sets, which includes physical and virtual (including statistics) channels or use the Developer Tools to make changes to the existing channel set to meet your needs. Thought Technology also provides a service to make channel sets for you. Each of the 7 different channel sets allows for a different use of the ProComp+.
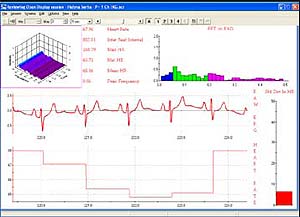
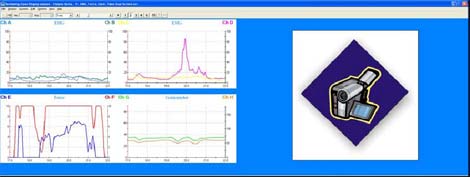
This screen (below) lets you monitor SEMG and other physiology simultaneously. Focus on EKG with real-time measurement of the inter-beat interval (IBI) displayed in a 3D and 2D power spectrum. See Max, Min and Mean heart rates and digital display to show the peak frequency. Follow line graphs of heart rate, raw EMG and a bar graph of Standard Deviation of the heart rate on the right of the screen. Temperature and Skin Conductance are shown on the screen with statistical values as well.
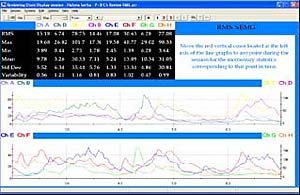
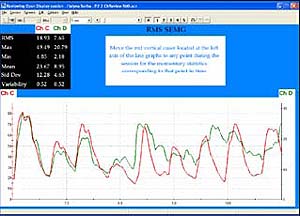
The review screen below shows two multi-line graphs and digital read outs for RMS data. Move the red vertical cursor and you see exact values of the Max, Mean, Min, Standard Deviation, Variability statistics.
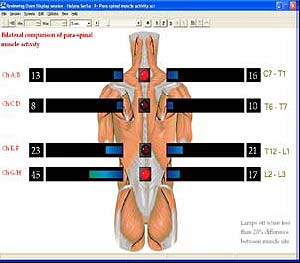
The screen below is for bilateral comparison of para-spinal muscle activity, divided into four pairs of SEMG sensors at C7-T1, T6-T7, T12-L1 and L2-L3. When the difference in SEMG between any pair is greater than 20% a light turns red. Bar-graphs and digital displays show RMS SEMG of each muscle.
This dual screen (below) shows two line graphs with RMS SEMG signals and two line graphs; one is for the Goniometer dual axis and one is for the two force sensors. The second monitor allows you to record video synchronized with the display of the other signals.
DynaMap for the ProComp2
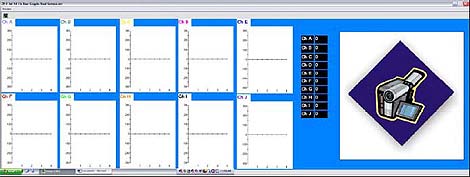
DynaMap for the ProComp2 includes 4 channel sets and 15 screens for 1 and 2-channel SEMG applications. It allows you to select from four different sensor combinations for the ProComp2 to use SEMG or either a force sensor, goniometer or torsiometer.
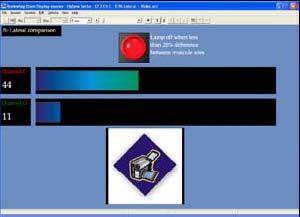
For example, choose a channel set for 2 MyoScan-Pro sensors for SEMG and load a screen to display RMS muscle activity at muscle pairs during movement. A difference greater than 20% between muscle pairs is indicated by the light turning red. Video enables viewing of the motion performed at the same time!
After you have used the above screen to provide feedback, you can then review the same data you just recorded in a completely different screen designed specifically to look at signal details. A red vertical cursor lets you see the momentary statistics corresponding to each point in time during the recording.
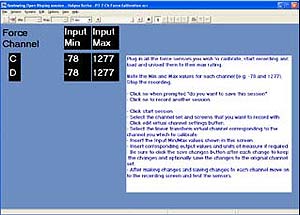
There are screens to calibrate force sensors, goniometers or torsiometers. The software allows you to manually enter the input Min and Max values and the corresponding output min and max values of the known load. It is also possible to enter the units of measure later, on the generated reports. Using the channel set of your choice and the appropriate sensors and screens you can measure the SEMG and the angle of the knee with a Goniometer.